Rank #3
Price :- 201.02 $
Market cap :- 3.002 Trillion $
Country :- 🇺🇸
Code name :- AAPL
Market dominance rank
USA :- 1st
Setiments
Bullish
Technical analysis
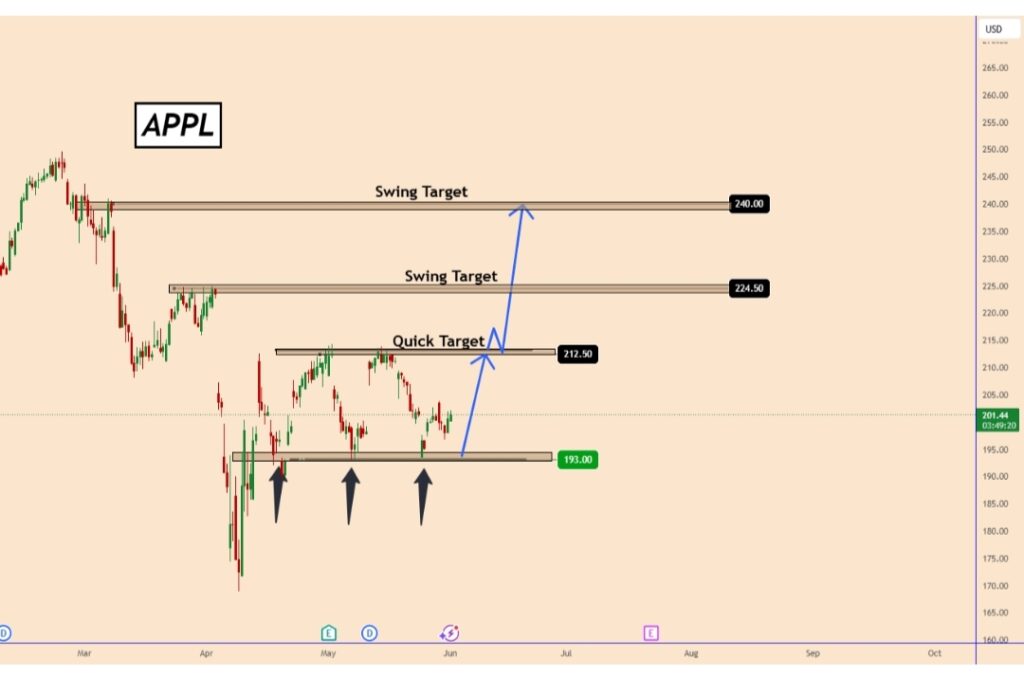
Support. : 193
Resistance : 212
1st target : 224
2nd target : 240
Logical reasoning
Rsi (14) Neutral
Adi Neutral
Commodity channel index. Neutral
Stochastic Neutral
Momentum Buy
Simple moving average. Sell
Exponential moving average. Buy
Hull moving average. Buy
Trending on internet
Buy
Investor sentiment
Positive ( Buy )
Some shortcut key details that you may like .
Trending deal 🤝 reports and possible outcome
Apple challenges eu order
Market cap at the end of year
Year Marketcap Change
2020 $2.255 T 75.2%
2021 $2.901 T 28.62%
2022 $2.066 T -28.77%
2023 $2.994 T 44.87%
2024 $3.863 T 29.02%
2025 $3.001 T -22.32%
Growth percentage of last 5 years
+147.11 %
Dividend of last five years
Year Dividend Change
2025 $0.51 -48.48%
2024 $0.99 4.21%
2023 $0.95 4.40%
- $0.91 5.20%
2021 $0.86 7.12%
2020 $0.81 6.25%
Pe ratio :- 31.2
Price to earning ratio as of 2025
Debt ratio :- 147%
Earning per stock :- 6.43$
Liquidity :- High
Net margin :- 24.3%
Profit per 100$ company retain 24.3$
Financial performance
It is expected to report a significant revenue of 400 Billion$ up 4.04%
Price to earning ratio
33X


Leave a Reply